gnuplot - Leo's Utopia
gnuplot
原文:http://www.linuxlinks.com/article/20080809061303415/gnuplot.html
| gnuplot 4.4.0 |
|
价格 系统要求 支持站点:文档, 常见问题,gnuplot 小提示, Gnuplot实用, 使用gnuplot可视化您的数据, SourceForge 项目页 选择评论: |
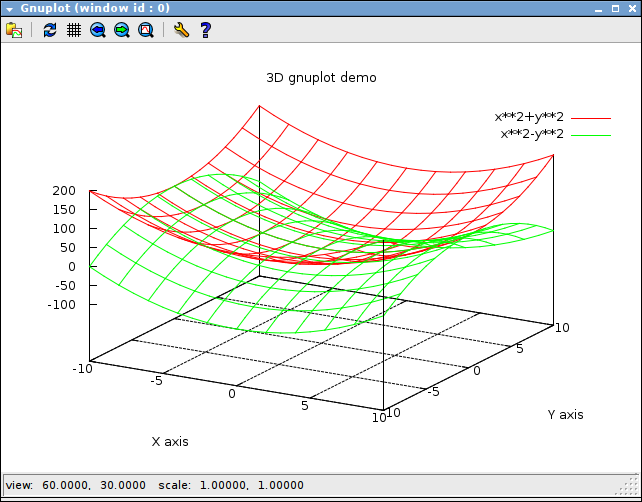
gnuplot是一个命令驱动的交互性函数绘图程序。它可以用来绘制许多不同的格式的二维和三维函数图和数据点图。它的设计目的主要是用于科学数据的可视化显示。
这个软件是从数据和函数绘制二维和三维图形。 gnuplot的支持输出格式很多,包括很多打印机的驱动程序,(La)TeX,(x)fig,Postscript,以及其他。
gnuplot可以生成直接在屏幕上的输出,或是许多不同的图形文件格式,包括PNG,EPS,SVG,JPEG和许多其他许多格式。它也可以直接生成LaTeX的代码,这些代码可以直接包含在LaTeX文档中,这样可以充分利用LaTeX的字体和强大公式能力。该方案可以即可以交互式使用,也可以在批处理模式中作为脚本使用。
它的数据文件和自定义函数可以被内部的类C语言操作。它也可以进行平滑,样条拟合,或非线性配合,以及复数处理。
gnuplot 是GNU Octave,Maxima和gretl的绘图引擎, 而且它也可以在很多不同的脚本语言中使用, 包括Perl,Python,Ruby和Smalltalk。
其特性包括:
- 绘制任何数量的函数,建立了C操作符,C库函数,库函数,还有一些C没有的东西,像**,sgn()等。它也支持绘制数据文件,以及对实际数据和理论曲线进行对比。
- 支持用户自定义X和Y范围(可选自动范围),智能轴缩放,智能节点标记。
- 类TEX的格式化文字标签,标题,轴,数据点
- 用户自定义的常量和函数
- 命令行退出和命令行替换
- 加载和保存能力
- 输出重定向
- 所有的计算均在复数域内进行
Sun, 25 Sep 2022 14:34:47 +0800
Every year the BSEB is provided the latest updated model question paper for intermediate Hindi Medium and English Medium students from past years old examination set wise question paper with expert answers to theory and objective type questions for all subjects of Hindi, English, Mathematics, Physics, Chemistry, Biology, Computer Science, Bihar Board 12th Science Question Paper Multimedia & Web Technology for BSEB Inter science stream students.Every year the BSEB is provided the latest updated model question paper for intermediate Hindi Medium and English Medium students from past years old examination set wise question paper with expert answers to theory and objective type questions for all subjects
Mon, 14 Nov 2022 17:36:55 +0800
Accidentally i have come across this website and little bit confused about the details you have shared here. This post deals with the details regarding gnuplot which is a command-driven interactive CBD Soaps function plotting program. It can be used to plot 2D and 3D function plots and data point plots in many different formats. I'm looking here for more updates on that.
Wed, 16 Nov 2022 05:15:38 +0800
Gnuplot is a free, open-source plotting program that has been around since 1986. It is commonly used for scientific and engineering data. Restaurant POS Software Dubai Gnuplot can be used to create two- and three-dimensional plots of functions, data, and data fit equations.
Fri, 30 Dec 2022 19:48:01 +0800
GNUplot is a free and open-source software package for creating plots of data. It is commonly used in scientific and engineering fields to plot functions and data, and it is also used to create plots for publication. GNUplot supports a wide range of output arthritis and rheumatology formats, including PostScript, PDF, and various bitmap formats, and it can be used on a variety of operating systems, including Windows, macOS, and Linux.